Skip to content Skip to left sidebar Skip to footer

Author: admin

Hazard map tutorial in QGIS

Here is a basic tutorial on how to create a hazard map in QGIS:

Step 1: Obtain Hazard Data
– Find and download hazard data from reliable sources such as government agencies or research institutions. This data can include information on hazards like floods, earthquakes, landslides, etc.

Step 2: Import Data into QGIS
– Open QGIS and import the hazard data into the project. You can do this by clicking on the “Add Layer” button and selecting the data file.

Step 3: Symbolize Hazard Data
– Once the hazard data is imported, symbolize it based on the type of hazard. You can use different colors, symbols, or styles to represent different hazard levels.

Step 4: Add Base Map
– Add a base map to provide context to the hazard data. You can use online basemaps like OpenStreetMap or Google Maps as a reference.

Step 5: Analyze and Overlay Data
– Overlay the hazard data with other relevant spatial data such as population density, infrastructure, or land use to identify areas of high risk.

Step 6: Create a Layout
– Design a layout for your hazard map by adding a legend, scale bar, title, and other necessary elements. This will help in presenting the information clearly.

Step 7: Export and Share
– Once you are satisfied with your hazard map, export it as an image or PDF file and share it with relevant stakeholders or the public.

Remember, creating a hazard map requires careful consideration of data accuracy, visualization techniques, and communication of risks. Make sure to validate your data sources and consult with experts in the field to ensure the map is informative and useful.

About QGIS

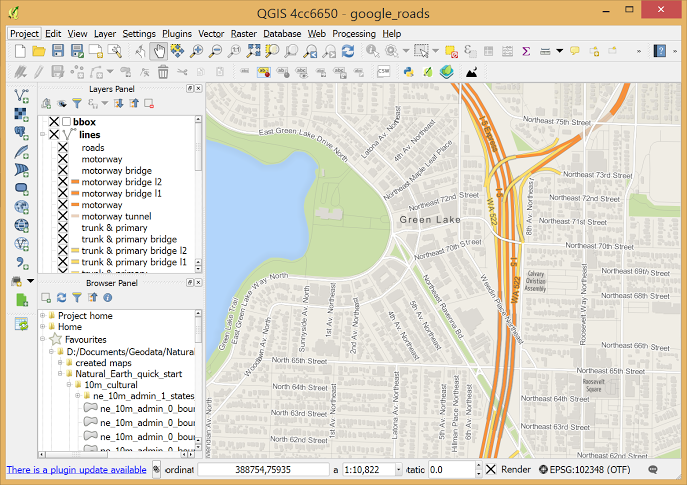
QGIS is a user friendly Open Source Geographic Information System (GIS) licensed under the GNU General Public License. QGIS is an official project of the Open Source Geospatial Foundation (OSGeo). It runs on Linux, Unix, Mac OSX, Windows and Android and supports numerous vector, raster, and database formats and functionalities.

Intallation Plugin Qgis

To install a plugin in QGIS, follow these steps:

1. Open QGIS and go to the Plugins menu.
2. Click on Manage and Install Plugins.
3. In the Plugins window, you can search for the plugin you want to install by typing its name in the search bar.
4. Once you find the plugin, click on Install Plugin to download and install it.
5. After the installation is complete, the plugin will appear in the Installed tab of the Plugins window.
6. You may need to restart QGIS for the plugin to be fully activated.
7. You can access the plugin by going to the Plugins menu and selecting the plugin from the list.

That’s it! You have successfully installed a plugin in QGIS.

Coastal Resilience

Coastal resilience means building the ability of a community to “bounce back” after hazardous events such as hurricanes, coastal storms, and flooding – rather than simply reacting to impacts

Coastal areas are exposed to a number of hazards including sudden onset hazards such as tsunami and storm surges, and
slow onset hazards such as sea level rise due to climate change. Supporting the resilience of communities in coastal areas
in facing these threats and challenges requires an in-depth understanding of their natural and demographic
characteristics and analysis of the actual and potential trends that should inform development planning and decision-making processes.
This Coastal Resilience Toolkit was developed under the regional engagement component of the Australia-Indonesia
The partnership with the Disaster Risk Management Program (SIAP SIAGA) aims to support decision-makers in conducting technical
analyses and designing collaborative approaches that will mitigate disaster-related threats and enhance the resilience of
coastal areas and their residents.

The Coastal Resilience Toolkit (CRT) is a relatively simple-to-use set of procedures, packaged within a software-based
toolkit which aims to support governments in coastal areas to attain sustainable coastal resilience for populations at
risk of threats emanating from their location next to the sea.

The CRT operates on a platform based on QGIS software, a desktop geographic information system application that
supports viewing, editing, reporting, and analysis of geospatial data. Its ability to analyse and visualise digital information
makes it a state-of-the-art tool to enable a data-supported approach to the development of coastal resilience mapping
and related mitigation efforts. The CRT works in complementarity with and relies upon additional inputs such as the
outcomes of discussion forums, the provision of information from resource persons, expert judgment, and other
analytical tools outside QGIS capabilities.

The CRT also provides a solutions database which is based on documented best practices from Indonesia and Australia in
responding to various coastal hazards (abrasion, extreme sea waves, tsunami) and damage types (human settlements,
agriculture, mangrove, coral reef, etc). These solutions are either nature-based or a combination of hard structures (such
as sea walls, and wave breakers) and soft structures (e.g. mangroves), are environmentally friendly, cost-effective, include
a strong community involvement element, and are integrated with other aspects of development, particularly economics.

TECHNICAL FEATURES
As QGIS is a free and open-source software hence the CRT and all its features are free and can be modified according to
the local demand. The CRT can be accessed via BNPB website (web address and contact person to be confirmed) and
provides several technical features


Technical Features CRT

TECHNICAL FEATURES
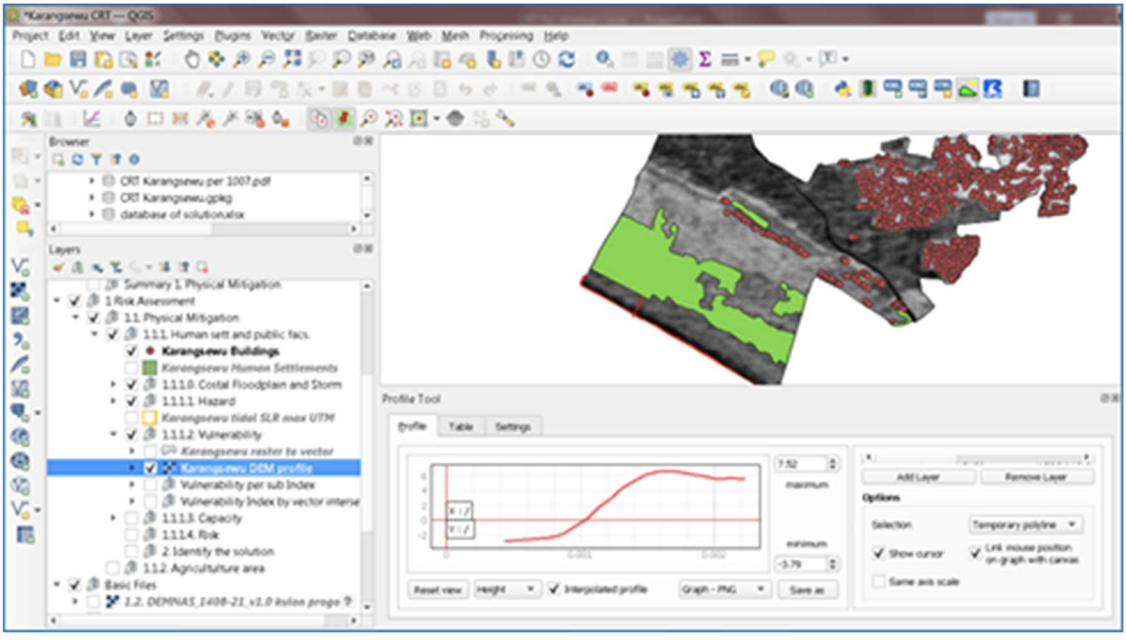
As QGIS is a free and open-source software hence the CRT and all its features are free and can be modified according to the local demand. The CRT can be accessed via BNPB website (web address and contact person to be confirmed) and provides several technical features as follows: CRT Layer and Profile Tool snapshot for risk assessment i. Generation of a dedicated dataset of spat

Coastal Resilience Toolkit

Perangkat yang berisi panduan praktis bagi pemerintah dan pemangku kepentingan dalam mengelola risiko bencana di wilayah pesisir dengan lebih baik sekaligus meningkatkan ketahanan masyarakat. Toolkit ini berisi sejumlah produk pengetahuan pilihan seperti praktik, pelajaran dan panduan yang telah dihasilkan di Indonesia dan Australia serta dari mitra lain seperti organisasi internasional yang bersedia berbagi pengetahuan.

Risk Assessment COASTAL RESILIENCE TOOLKIT (CRT)

Definition. This step assesses the level of coastal risk according to 3 risk intervals (high, medium, low) The risk is calculated by determining , in order, the hazard index, vulnerability index, capacity index, and finally the risk index itself.

Method. The calculation of the coastal risk is based on the calculation method in Peraturan Kepala BNPB Nomor 02 Tahun 2012 tentang Pedoman Umum Pengkajian Risiko Bencana.(See page 1)

Sub steps.

  • Hazard and coastal damage types. Identify the hazard type(s) (tsunami, extreme sea wave and abrasion) and enter each hazard type into the Hazard Index according to its constituent indicators.Then identify the related coastal damage type(s) (12 types, Annex 3) and the corresponding damage level.
  • Coastal hazard projections. Calculate sea behaviour related hazards based on existing and projected conditions.
  • Vulnerability Indexes. Vulnerability index consists of Social, Economic, Physical and Ecological Indexes. These indexes need to be calculated based on the specific characteristics of the coastal damage type which means that each type of coastal damage shall have its own vulnerability index.
  • Social Vulnerability Index consists of indicators for i) population density, ii) sex ratio, iii) poverty ratio, iv) disabled group ratio and v) age group ratio. Ratio i-v and Hazard Index creates the location-specific Population Exposure Index
  • Economic Vulnerability Index consists of indicators for i) productive land size (paddy field, plantation, agriculture land and fish pond) and ii) gross regional domestic product (GRDP)
  • Physical Vulnerability Index consists of indicators for i) houses (permanent, semi-permanent, non-permanent), ii) public facilities and iii) critical facilities.
  • Ecological Vulnerability Index consists of indicators for land cover: i) conservation forest, ii) mangrove, iii) swamp, and iv) bushes.
  • Economic Vulnerability Index, Physical Index and Ecological Index altogether with Hazard Index compose the Loss Index.
    • . Capacity Index. There are 5 components/indicators which need to be calculated:i) prevalence of regulations and disaster mitigation institutions, ii) availability of early warning and Kajian Risiko Bencana (Disaster Risk Study), iii) level/state of education on disaster knowledge,iv) evidence of prior reduction of basic risk factors , v) disaster preparedness in all levels.
    • Risk Index. The Risk Index is calculated according to the following formula:Remarks for CRT utilisation in Indonesia.

      Following applicable regulations and practice, all scientific data which is required in sub step 1.1 – 1.5 should be prepared by authorised institutions. The Regency’s/Municipality’s Disaster Management Authority (BPBD) shall

Mangrove planting data

Mangrove planting is a common strategy used to enhance coastal resilience and protect shorelines from erosion and storm damage. The following data can be collected and analyzed to assess the effectiveness of mangrove planting in improving coastal resilience:

1. Number of mangrove trees planted: Tracking the number of mangrove trees planted can provide insight into the scale of the restoration effort and the potential impact on coastal resilience.

2. Survival rate of planted mangrove trees: Monitoring the survival rate of planted mangrove trees can help determine the success of the restoration project and identify factors that may be affecting tree health.

3. Growth rate of mangrove trees: Measuring the growth rate of mangrove trees can indicate how quickly the mangrove forest is establishing and expanding, which can contribute to shoreline stabilization and protection.

4. Biodiversity assessment: Conducting biodiversity assessments before and after mangrove planting can help determine the impact of the restoration project on local ecosystems and the overall health of the coastal environment.

5. Coastal erosion monitoring: Monitoring changes in shoreline erosion rates before and after mangrove planting can help assess the effectiveness of the restoration project in protecting coastal areas from erosion and storm damage.

6. Community engagement: Collecting data on community involvement in mangrove planting initiatives can help measure the social impact of the restoration project and identify opportunities for further engagement and support.

By analyzing these data points, researchers and policymakers can better understand the effectiveness of mangrove planting in enhancing coastal resilience and inform future restoration efforts.

Pemerintah Indonesia Percepat Rehabilitasi Mangrove dengan Program Coastal Resilience

Lorem ipsum dolor sit amet, consectetur adipiscing elit, sed do eiusmod tempor incididunt ut labore et dolore magna aliqua. Quam adipiscing vitae proin sagittis nisl rhoncus. Ac felis donec et odio pellentesque diam volutpat. Nec tincidunt praesent semper feugiat nibh sed pulvinar. Egestas sed tempus urna et. Mollis nunc sed id semper risus in hendrerit gravida rutrum. Adipiscing diam donec adipiscing tristique risus nec feugiat in fermentum. Tristique risus nec feugiat in fermentum posuere urna nec tincidunt. Id volutpat lacus laoreet non curabitur gravida arcu. Netus et malesuada fames ac turpis. Tempor orci dapibus ultrices in iaculis nunc sed augue lacus. Amet mattis vulputate enim nulla. Nec ultrices dui sapien eget mi. Faucibus vitae aliquet nec ullamcorper sit. Lectus urna duis convallis convallis tellus id interdum velit. Donec enim diam vulputate ut pharetra sit amet. Suspendisse sed nisi lacus sed viverra. Arcu non sodales neque sodales ut etiam sit. A lacus vestibulum sed arcu non odio euismod lacinia.

Read More

Lautan Sehat, Masyarakat Sehat: Proyek Baru akan Memperkuat Ketahanan Daerah Pesisir dan Ekonomi Biru di Indonesia

Lorem ipsum dolor sit amet, consectetur adipiscing elit, sed do eiusmod tempor incididunt ut labore et dolore magna aliqua. Quam adipiscing vitae proin sagittis nisl rhoncus. Ac felis donec et odio pellentesque diam volutpat. Nec tincidunt praesent semper feugiat nibh sed pulvinar. Egestas sed tempus urna et. Mollis nunc sed id semper risus in hendrerit gravida rutrum. Adipiscing diam donec adipiscing tristique risus nec feugiat in fermentum. Tristique risus nec feugiat in fermentum posuere urna nec tincidunt. Id volutpat lacus laoreet non curabitur gravida arcu. Netus et malesuada fames ac turpis. Tempor orci dapibus ultrices in iaculis nunc sed augue lacus. Amet mattis vulputate enim nulla. Nec ultrices dui sapien eget mi. Faucibus vitae aliquet nec ullamcorper sit. Lectus urna duis convallis convallis tellus id interdum velit. Donec enim diam vulputate ut pharetra sit amet. Suspendisse sed nisi lacus sed viverra. Arcu non sodales neque sodales ut etiam sit. A lacus vestibulum sed arcu non odio euismod lacinia.

Faucibus ornare suspendisse sed nisi. Consequat id porta nibh venenatis cras sed felis. Sagittis aliquam malesuada bibendum arcu vitae elementum curabitur. Gravida quis blandit turpis cursus in hac habitasse. In nibh mauris cursus mattis molestie a iaculis. Aliquam eleifend mi in nulla posuere. Senectus et netus et malesuada fames. Ac turpis egestas maecenas pharetra convallis posuere. Porttitor eget dolor morbi non. Sollicitudin aliquam ultrices sagittis orci a scelerisque. Scelerisque varius morbi enim nunc faucibus a pellentesque sit amet. Tortor at auctor urna nunc. Urna nunc id cursus metus aliquam eleifend mi in. Ullamcorper malesuada proin libero nunc consequat interdum varius. Lorem ipsum dolor sit amet consectetur adipiscing elit pellentesque. Risus nullam eget felis eget. Et molestie ac feugiat sed lectus vestibulum. Pellentesque id nibh tortor id aliquet lectus.

Enim nulla aliquet porttitor lacus luctus accumsan. Sapien et ligula ullamcorper malesuada proin libero. Purus gravida quis blandit turpis. Nisl purus in mollis nunc sed id. At augue eget arcu dictum varius duis at consectetur lorem. Nulla posuere sollicitudin aliquam ultrices sagittis orci a scelerisque. Iaculis eu non diam phasellus vestibulum lorem sed risus ultricies. Quam viverra orci sagittis eu. Nunc lobortis mattis aliquam faucibus purus in massa tempor. Volutpat maecenas volutpat blandit aliquam etiam erat velit. Metus aliquam eleifend mi in nulla posuere. Cum sociis natoque penatibus et magnis dis parturient montes. Amet porttitor eget dolor morbi non arcu risus. Interdum posuere lorem ipsum dolor.

Amet commodo nulla facilisi nullam vehicula. Etiam tempor orci eu lobortis elementum nibh. Gravida arcu ac tortor dignissim convallis aenean et tortor at. Maecenas ultricies mi eget mauris pharetra. Morbi enim nunc faucibus a. Mattis nunc sed blandit libero volutpat sed cras ornare. Donec enim diam vulputate ut pharetra sit. Arcu dui vivamus arcu felis bibendum ut tristique et. Enim neque volutpat ac tincidunt vitae semper. Feugiat pretium nibh ipsum consequat nisl. Cras tincidunt lobortis feugiat vivamus at augue eget arcu. Eget est lorem ipsum dolor sit.

Diam quis enim lobortis scelerisque. Tellus in hac habitasse platea. Nunc scelerisque viverra mauris in aliquam sem fringilla. Cras ornare arcu dui vivamus arcu felis bibendum ut tristique. Habitasse platea dictumst vestibulum rhoncus est pellentesque elit. Proin fermentum leo vel orci porta non pulvinar. Sed vulputate mi sit amet mauris commodo quis imperdiet. Tellus cras adipiscing enim eu turpis. Lacus viverra vitae congue eu. Placerat orci nulla pellentesque dignissim enim sit. Nibh ipsum consequat nisl vel. Bibendum neque egestas congue quisque egestas diam in arcu cursus.